

Home and security products company Fortune Brands (NYSE:FBIN) met Wall Street’s revenue expectations in Q2 CY2025, but sales fell by 3% year on year to $1.2 billion. Its GAAP profit of $0.83 per share was 13% below analysts’ consensus estimates.
Is now the time to buy Fortune Brands? Find out by accessing our full research report, it’s free.
Fortune Brands (FBIN) Q2 CY2025 Highlights:
- Revenue: $1.2 billion vs analyst estimates of $1.2 billion (3% year-on-year decline, in line)
- EPS (GAAP): $0.83 vs analyst expectations of $0.95 (13% miss)
- Adjusted EBITDA: $250.3 million vs analyst estimates of $241.1 million (20.8% margin, 3.8% beat)
- EPS (GAAP) guidance for the full year is $3.85 at the midpoint, beating analyst estimates by 7.8%
- Operating Margin: 14.3%, down from 16.1% in the same quarter last year
- Free Cash Flow Margin: 19.8%, up from 18% in the same quarter last year
- Organic Revenue fell 1% year on year (-2.1% in the same quarter last year)
- Market Capitalization: $6.56 billion
Company Overview
Targeting a wide customer base of residential and commercial customers, Fortune Brands (NYSE:FBIN) makes plumbing, security, and outdoor living products.
Revenue Growth
A company’s long-term performance is an indicator of its overall quality. Even a bad business can shine for one or two quarters, but a top-tier one grows for years. Regrettably, Fortune Brands’s sales grew at a tepid 5.9% compounded annual growth rate over the last five years. This was below our standard for the industrials sector and is a poor baseline for our analysis.
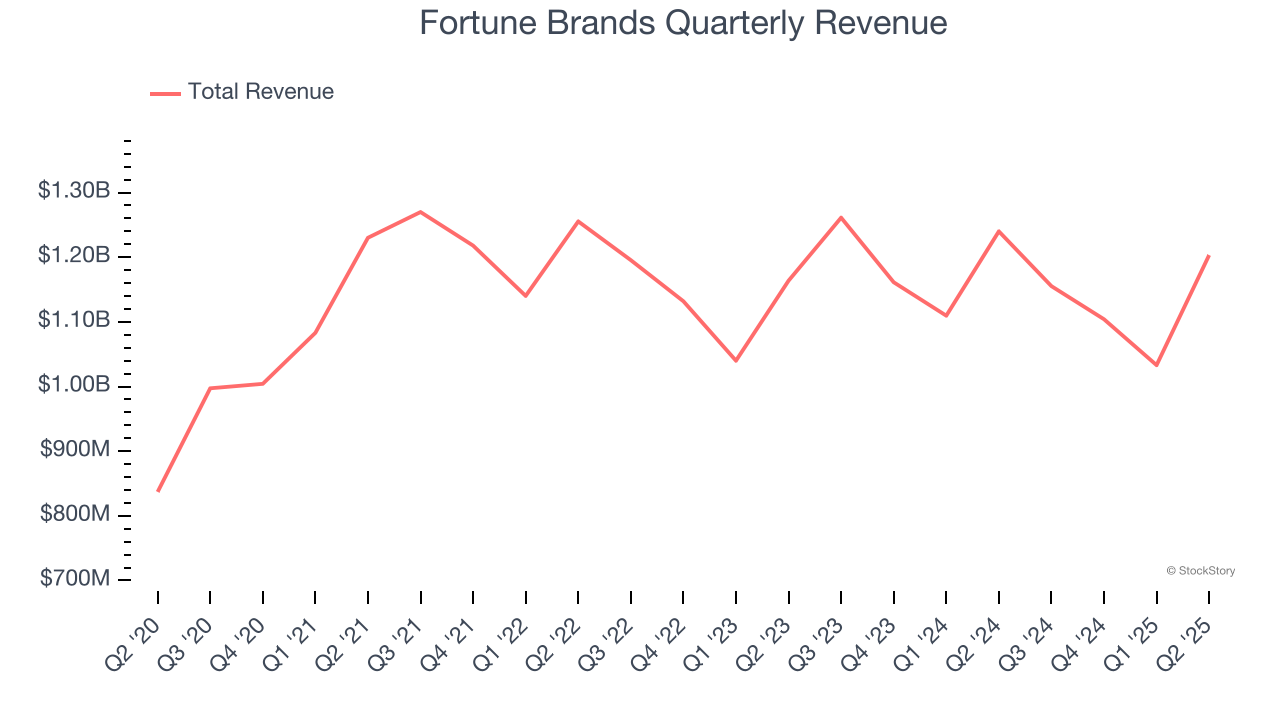
We at StockStory place the most emphasis on long-term growth, but within industrials, a half-decade historical view may miss cycles, industry trends, or a company capitalizing on catalysts such as a new contract win or a successful product line. Fortune Brands’s recent performance shows its demand has slowed as its revenue was flat over the last two years. 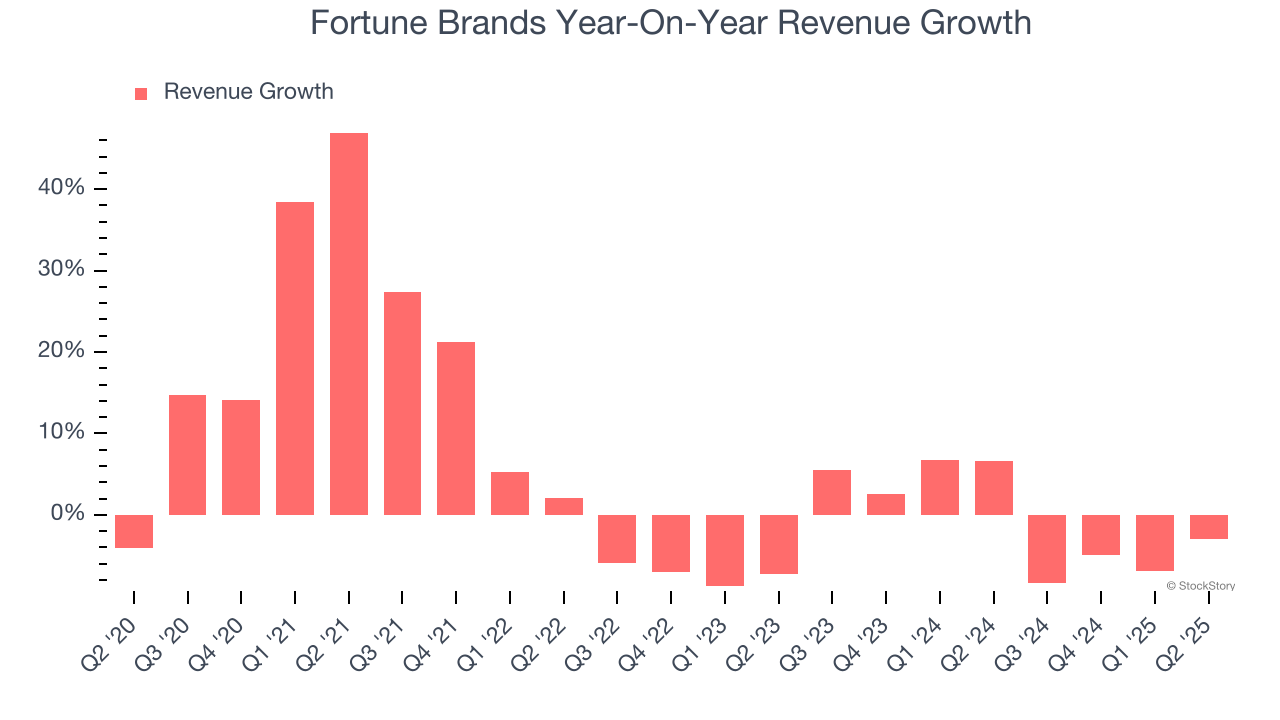
We can better understand the company’s sales dynamics by analyzing its organic revenue, which strips out one-time events like acquisitions and currency fluctuations that don’t accurately reflect its fundamentals. Over the last two years, Fortune Brands’s organic revenue averaged 3.5% year-on-year declines. Because this number is lower than its two-year revenue growth, we can see that some mixture of acquisitions and foreign exchange rates boosted its headline results. 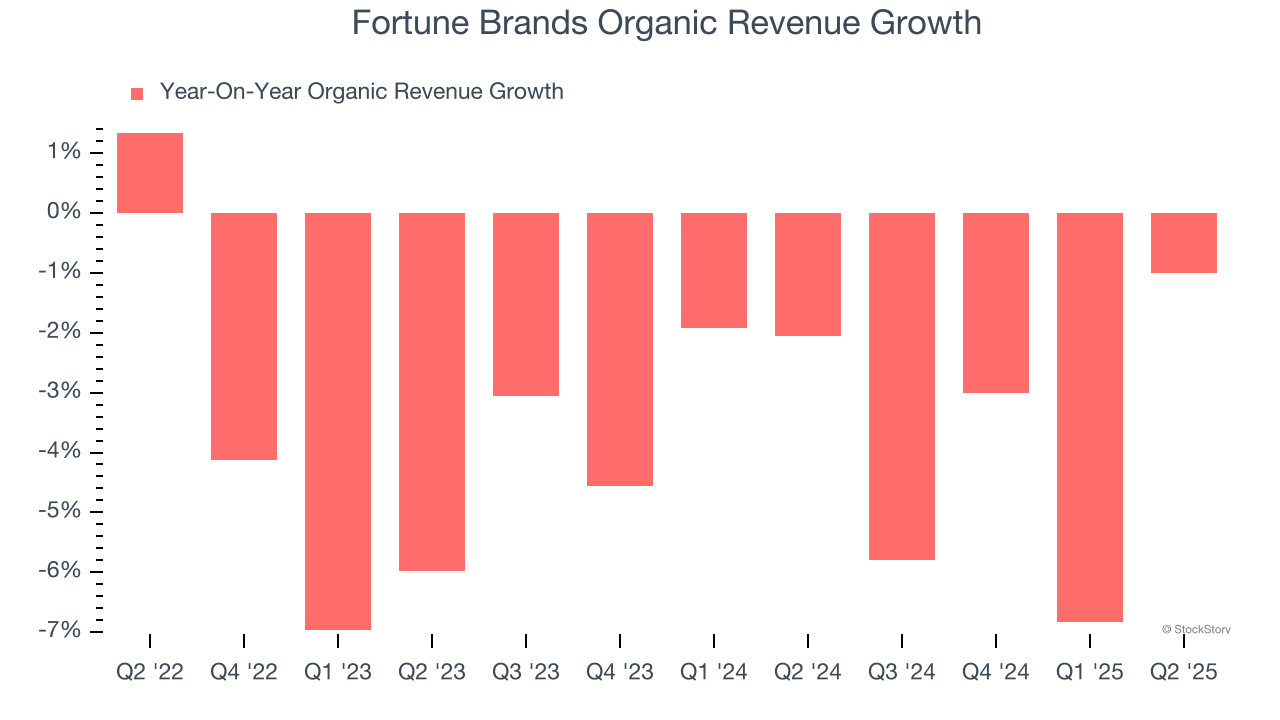
This quarter, Fortune Brands reported a rather uninspiring 3% year-on-year revenue decline to $1.2 billion of revenue, in line with Wall Street’s estimates.
Looking ahead, sell-side analysts expect revenue to grow 2.1% over the next 12 months. Although this projection indicates its newer products and services will catalyze better top-line performance, it is still below average for the sector.
Software is eating the world and there is virtually no industry left that has been untouched by it. That drives increasing demand for tools helping software developers do their jobs, whether it be monitoring critical cloud infrastructure, integrating audio and video functionality, or ensuring smooth content streaming. Click here to access a free report on our 3 favorite stocks to play this generational megatrend.
Operating Margin
Fortune Brands has been a well-oiled machine over the last five years. It demonstrated elite profitability for an industrials business, boasting an average operating margin of 16.9%.
Analyzing the trend in its profitability, Fortune Brands’s operating margin decreased by 9.1 percentage points over the last five years. This raises questions about the company’s expense base because its revenue growth should have given it leverage on its fixed costs, resulting in better economies of scale and profitability.
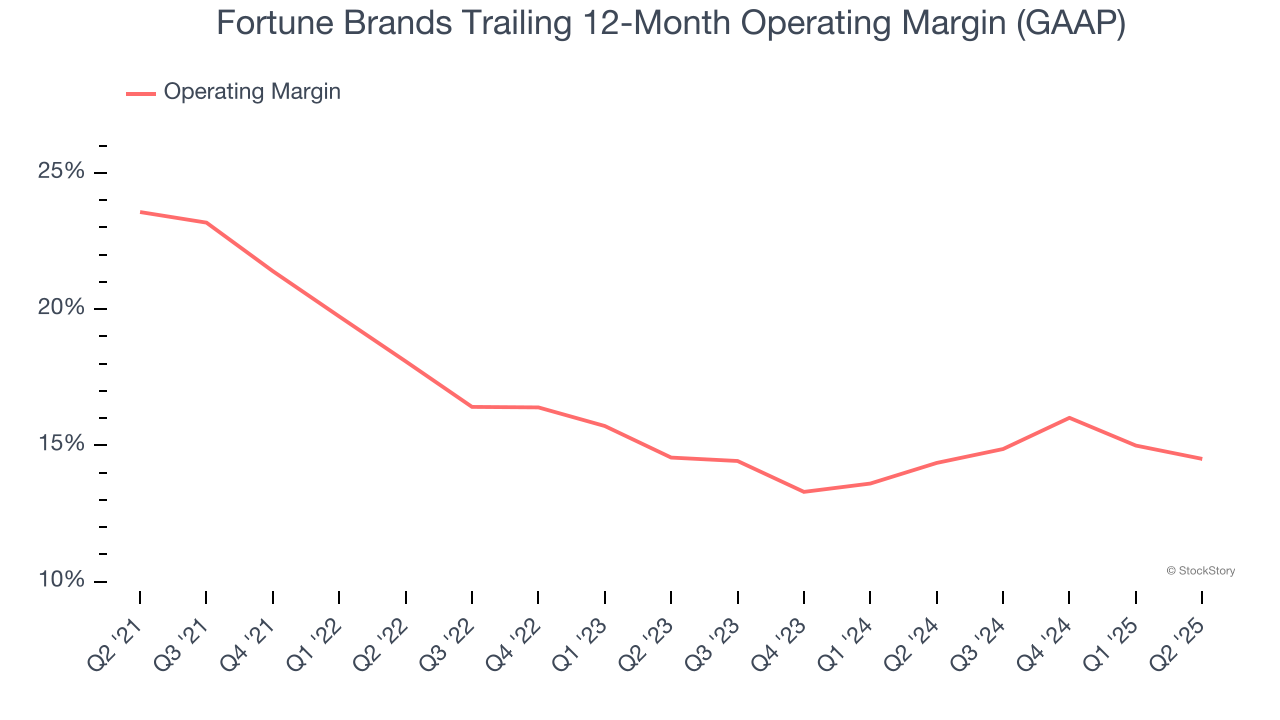
This quarter, Fortune Brands generated an operating margin profit margin of 14.3%, down 1.8 percentage points year on year. Conversely, its gross margin actually rose, so we can assume its recent inefficiencies were driven by increased operating expenses like marketing, R&D, and administrative overhead.
Earnings Per Share
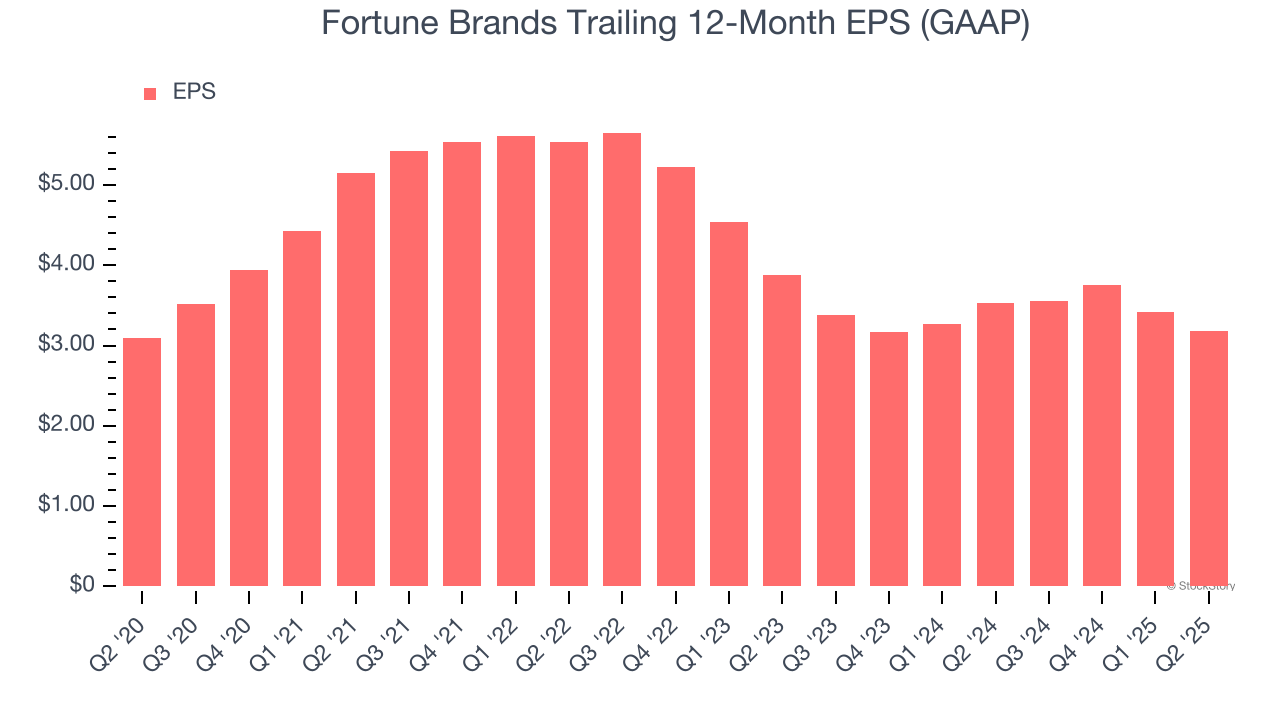
We track the long-term change in earnings per share (EPS) for the same reason as long-term revenue growth. Compared to revenue, however, EPS highlights whether a company’s growth is profitable.
Fortune Brands’s flat EPS over the last five years was below its 5.9% annualized revenue growth. This tells us the company became less profitable on a per-share basis as it expanded due to non-fundamental factors such as interest expenses and taxes.
Diving into the nuances of Fortune Brands’s earnings can give us a better understanding of its performance. As we mentioned earlier, Fortune Brands’s operating margin declined by 9.1 percentage points over the last five years. This was the most relevant factor (aside from the revenue impact) behind its lower earnings; interest expenses and taxes can also affect EPS but don’t tell us as much about a company’s fundamentals.
Like with revenue, we analyze EPS over a more recent period because it can provide insight into an emerging theme or development for the business.
For Fortune Brands, its two-year annual EPS declines of 9.5% show its recent history was to blame for its underperformance over the last five years. These results were bad no matter how you slice the data.
In Q2, Fortune Brands reported EPS at $0.83, down from $1.06 in the same quarter last year. This print missed analysts’ estimates. Over the next 12 months, Wall Street expects Fortune Brands’s full-year EPS of $3.18 to grow 24.1%.
Key Takeaways from Fortune Brands’s Q2 Results
We were impressed by Fortune Brands’s optimistic full-year EPS guidance, which blew past analysts’ expectations. We were also glad its organic revenue and EBITDA outperformed Wall Street’s estimates. On the other hand, its EPS missed. Still, we think this was a decent quarter with some key areas of upside. The stock remained flat at $54.54 immediately following the results.
So should you invest in Fortune Brands right now? When making that decision, it’s important to consider its valuation, business qualities, as well as what has happened in the latest quarter. We cover that in our actionable full research report which you can read here, it’s free.