

Genomics company Illumina (NASDAQ:ILMN) beat Wall Street’s revenue expectations in Q2 CY2025, but sales fell by 3% year on year to $1.06 billion. Its non-GAAP profit of $0.36 per share was 64.4% below analysts’ consensus estimates.
Is now the time to buy Illumina? Find out by accessing our full research report, it’s free.
Illumina (ILMN) Q2 CY2025 Highlights:
- Revenue: $1.06 billion vs analyst estimates of $1.05 billion (3% year-on-year decline, 1% beat)
- Adjusted EPS: $0.36 vs analyst expectations of $1.01 (64.4% miss)
- Adjusted Operating Income: $252 million vs analyst estimates of $221.3 million (23.8% margin, 13.8% beat)
- Management raised its full-year Adjusted EPS guidance to $4.50 at the midpoint, a 5.9% increase
- Operating Margin: 20.2%, down from 40.5% in the same quarter last year
- Free Cash Flow Margin: 19.3%, up from 4.5% in the same quarter last year
- Organic Revenue fell 3% year on year (-6.2% in the same quarter last year)
- Market Capitalization: $16.88 billion
Company Overview
Pioneering the ability to read the human genome at unprecedented speed and affordability, Illumina (NASDAQ:ILMN) develops and sells advanced DNA sequencing and microarray technologies that allow researchers and clinicians to analyze genetic variations and functions.
Revenue Growth
A company’s long-term sales performance can indicate its overall quality. Any business can put up a good quarter or two, but many enduring ones grow for years. Regrettably, Illumina’s sales grew at a mediocre 5% compounded annual growth rate over the last five years. This fell short of our benchmark for the healthcare sector and is a rough starting point for our analysis.
We at StockStory place the most emphasis on long-term growth, but within healthcare, a half-decade historical view may miss recent innovations or disruptive industry trends. Illumina’s performance shows it grew in the past but relinquished its gains over the last two years, as its revenue fell by 1.4% annually. 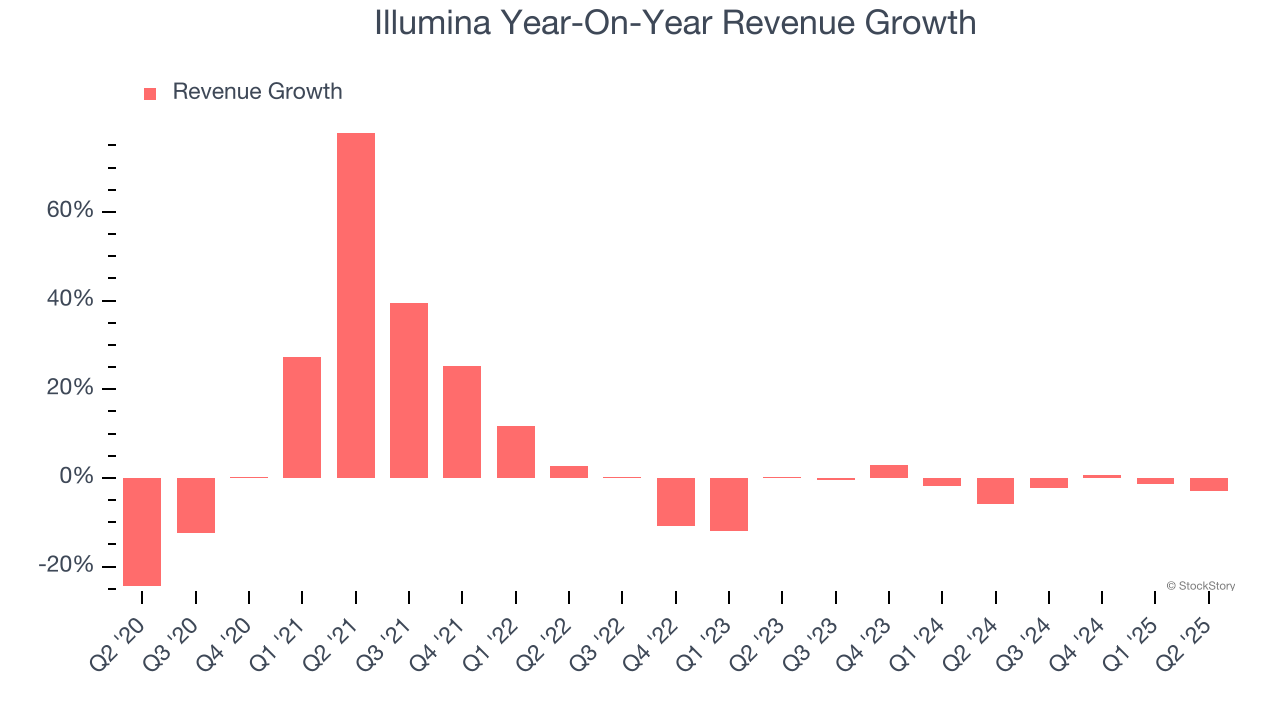
We can dig further into the company’s sales dynamics by analyzing its organic revenue, which strips out one-time events like acquisitions and currency fluctuations that don’t accurately reflect its fundamentals. Over the last two years, Illumina’s organic revenue averaged 1.3% year-on-year declines. Because this number aligns with its two-year revenue growth, we can see the company’s core operations (not acquisitions and divestitures) drove most of its results. 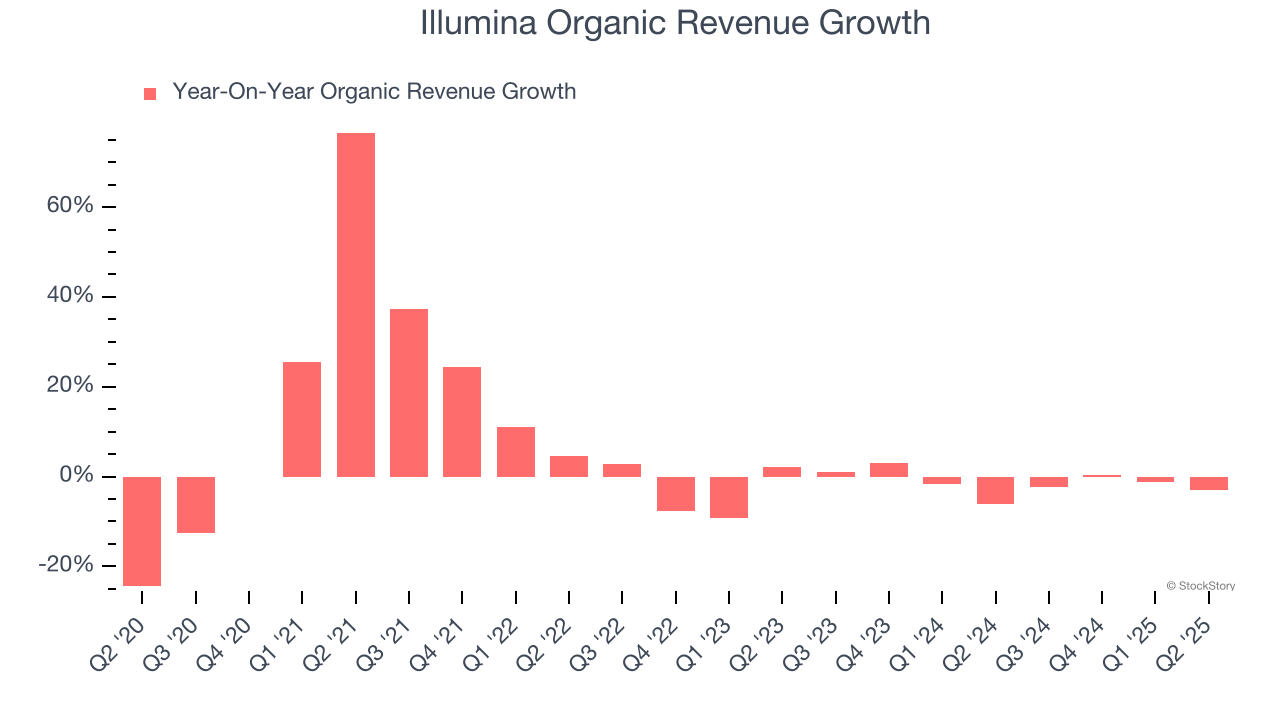
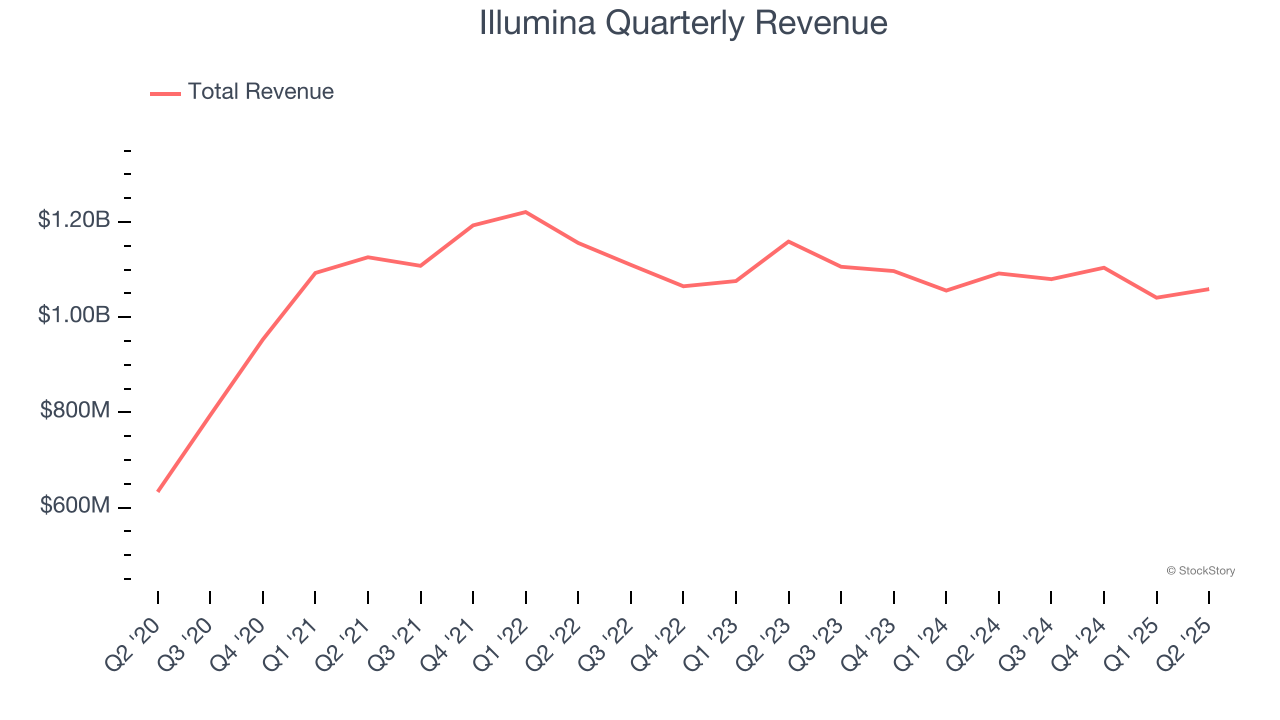
This quarter, Illumina’s revenue fell by 3% year on year to $1.06 billion but beat Wall Street’s estimates by 1%.
Looking ahead, sell-side analysts expect revenue to remain flat over the next 12 months. This projection doesn't excite us and suggests its newer products and services will not catalyze better top-line performance yet.
Here at StockStory, we certainly understand the potential of thematic investing. Diverse winners from Microsoft (MSFT) to Alphabet (GOOG), Coca-Cola (KO) to Monster Beverage (MNST) could all have been identified as promising growth stories with a megatrend driving the growth. So, in that spirit, we’ve identified a relatively under-the-radar profitable growth stock benefiting from the rise of AI, available to you FREE via this link.
Adjusted Operating Margin
Illumina has been an efficient company over the last five years. It was one of the more profitable businesses in the healthcare sector, boasting an average adjusted operating margin of 22.4%.
Looking at the trend in its profitability, Illumina’s adjusted operating margin decreased by 5 percentage points over the last five years, but it rose by 1.8 percentage points on a two-year basis. Still, shareholders will want to see Illumina become more profitable in the future.
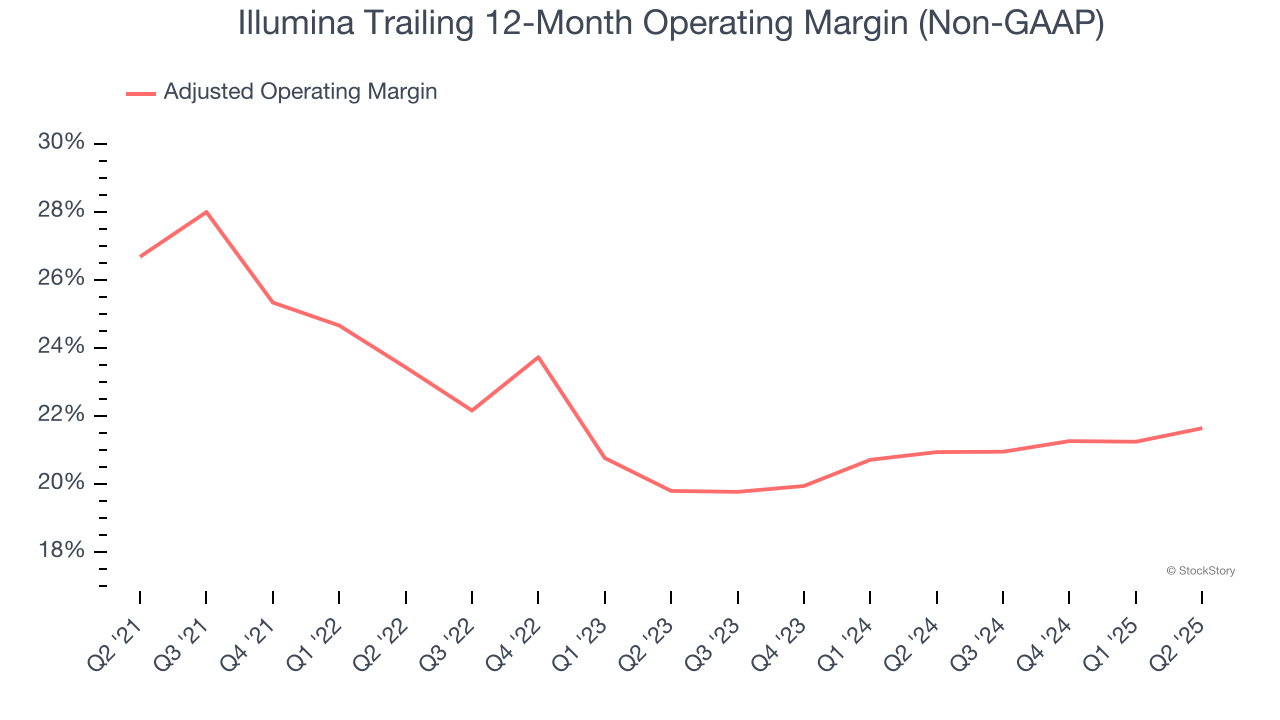
This quarter, Illumina generated an adjusted operating margin profit margin of 23.8%, up 1.6 percentage points year on year. This increase was a welcome development, especially since its revenue fell, showing it was more efficient because it scaled down its expenses.
Earnings Per Share
We track the long-term change in earnings per share (EPS) for the same reason as long-term revenue growth. Compared to revenue, however, EPS highlights whether a company’s growth is profitable.
Sadly for Illumina, its EPS declined by 10.3% annually over the last five years while its revenue grew by 5%. However, its adjusted operating margin actually improved during this time, telling us that non-fundamental factors such as interest expenses and taxes affected its ultimate earnings.
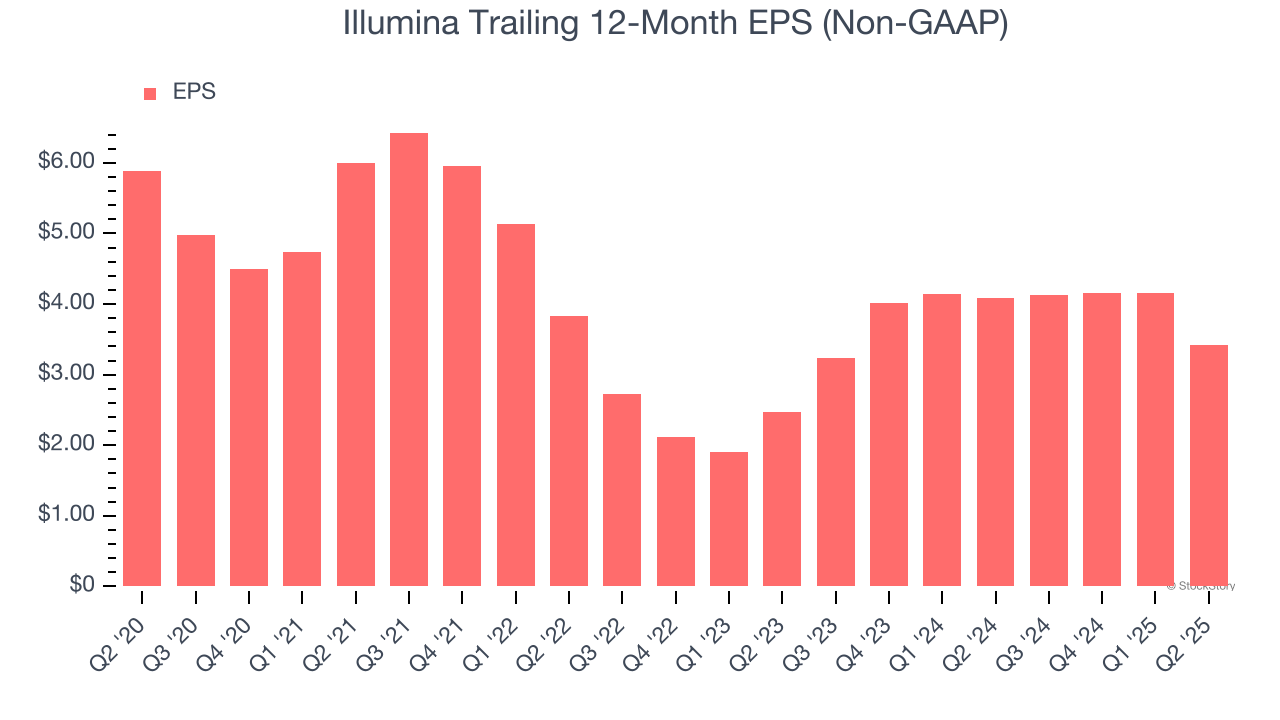
Diving into the nuances of Illumina’s earnings can give us a better understanding of its performance. As we mentioned earlier, Illumina’s adjusted operating margin expanded this quarter but declined by 5 percentage points over the last five years. Its share count also grew by 6.1%, meaning the company not only became less efficient with its operating expenses but also diluted its shareholders. 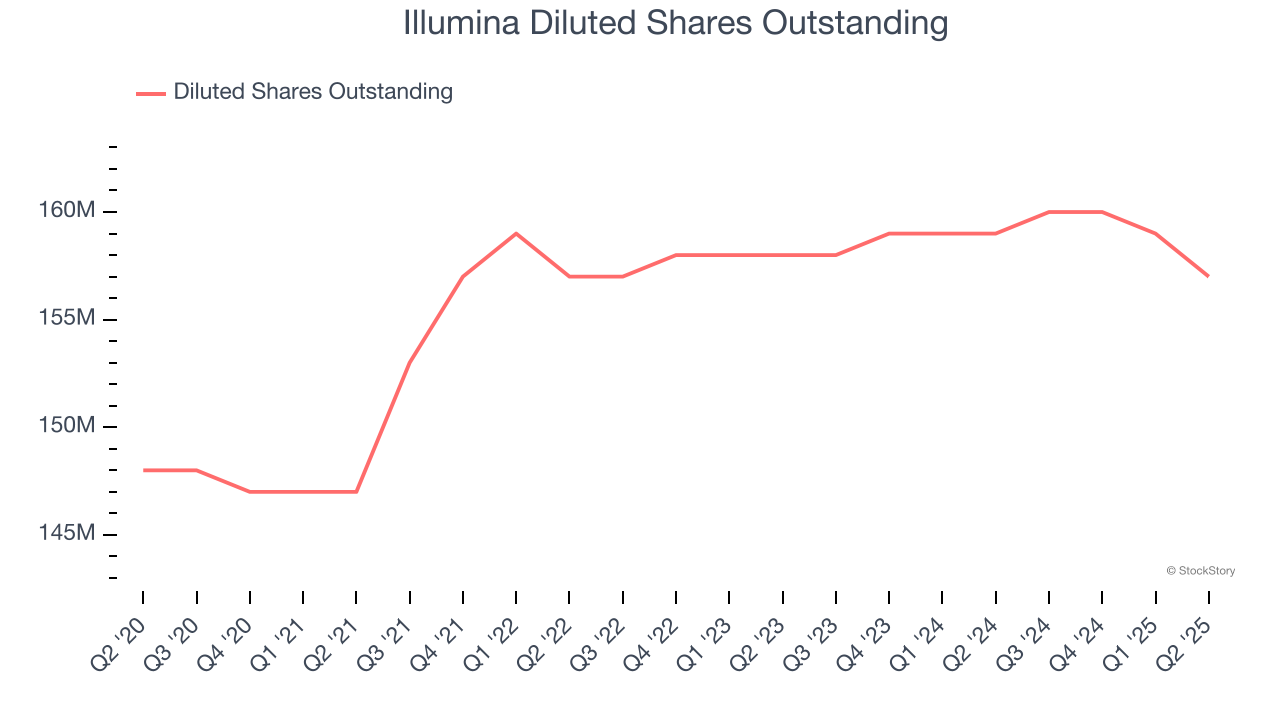
In Q2, Illumina reported adjusted EPS at $0.36, down from $1.09 in the same quarter last year. This print missed analysts’ estimates. Over the next 12 months, Wall Street expects Illumina’s full-year EPS of $3.42 to grow 30.2%.
Key Takeaways from Illumina’s Q2 Results
We were impressed by how significantly Illumina blew past analysts’ full-year EPS guidance expectations this quarter. We were also happy its revenue narrowly outperformed Wall Street’s estimates. On the other hand, its EPS missed. Overall, this print was mixed. Investors were likely hoping for more, and shares traded down 1.7% to $101.03 immediately after reporting.
So should you invest in Illumina right now? The latest quarter does matter, but not nearly as much as longer-term fundamentals and valuation, when deciding if the stock is a buy. We cover that in our actionable full research report which you can read here, it’s free.